Techno-Economic Strategy Framework: Transitioning from Legacy AgTech to Circular Agro-Industrial Ecosystems
- Executive Context: The Macro-Thermodynamic Crisis & AgTech Model Failure
Enterprise agricultural holdings operate under an unsustainable structural paradox. Modern industrial agriculture has systematically substituted natural ecosystem homeostasis with synthetic, energy-dense inputs derived from diminishing fossil reserves. While nominal financial claims and capital commitments expand, the underlying biophysical capacity of agricultural assets is eroding. Continuing to rely on legacy chemical-intensive practices and centralized digital management platforms introduces unacceptable operational and structural financial risk for institutional capital. To preserve asset value, guarantee food system security, and ensure long-term solvency, enterprise agricultural holdings must transition from legacy open-loop AgTech models to biophysically grounded, self-regulating agro-ecosystems. These closed-loop architectures internalize resource recycling, eliminate operational single points of failure, and enforce absolute thermodynamic solvency across broadacre operations.
Deconstructing the Macro-Thermodynamic Crisis
The structural fragility of contemporary agriculture stems from a fundamental decoupling between nominal financial claims and biophysical reality. Nominal claims—comprising agricultural debt, farmland asset valuations, and commodity derivatives—grow exponentially according to the compounding function:
D(t) = D_0 e^{rt}
In contrast, real physical agricultural yield \mathcal{Y}(t) is strictly bounded by photosynthetic solar capture, topsoil biological carrying capacity, and net available physical exergy:
\mathcal{Y}(t) \le \kappa \int \text{Exergy}_{\text{net}}(t) , dt
This mathematical divergence is driven by three deteriorating physical baselines:
- Topsoil Organic Matter (SOM) Depletion: Intensive tillage, synthetic salt accumulation, and continuous monoculture have reduced global topsoil organic matter from pre-industrial baseline levels of 5%–8% down to critical thresholds below 1.5%. This biological degradation collapses soil moisture retention and dielectric permeability, converting precipitation into destructive runoff and requiring larger applications of synthetic fertilizers to maintain baseline crop yields.
- Energy Return on Energy Invested (EROEI) Compression: During the Green Revolution, the energetic return of standard cereal crop production routinely exceeded 20:1. In modern industrial operations, full lifecycle EROEI—accounting for Haber-Bosch synthetic nitrogen synthesis, organophosphate production, heavy equipment manufacturing, and long-haul transport—has compressed to below 2:1 overall. In concentrated animal protein systems, lifecycle EROEI is deeply negative, operating at \le 0.3:1.
- Phosphorus Peak and Input Cost Spirals: The structural depletion of easily extractable rock phosphate and high-exergy fossil feedstocks drives structural price volatility for primary chemical inputs, creating an escalating cost structure that continuously erodes operating margins.
NOMINAL FINANCIAL CLAIMS & INPUT COSTS: D(t) = D_0 e^(rt)
▲
│ / [EXPONENTIAL FINANCIAL DEBT SPIRAL]
│ /
│ _.-‘
│ _.-‘
──┼─────────────────────────────────────────────────────────────────────────────
│ _…–” BIOPHYSICAL CARRYING CAPACITY CEILING
│ _…–” Y(t) Bounded by Photosynthesis & Thermodynamics
──┴─────────────────────────────────────────────────────────────────────────────►
Time
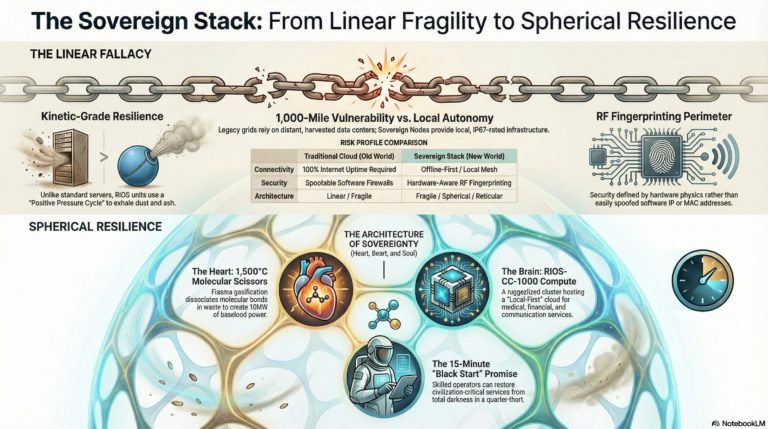
Critique of the “1,000-Mile Failure Model”
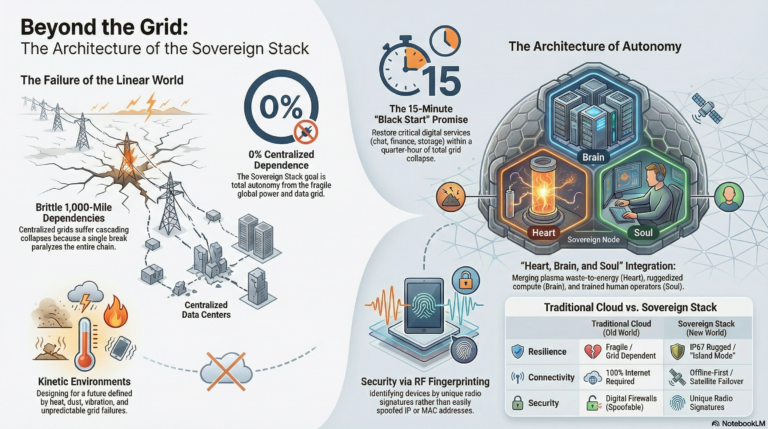
Legacy AgTech exacerbates this thermodynamic crisis by deploying centralized, cloud-tethered operational architectures—the “1,000-Mile Failure Model.” Commercial field management platforms (such as field-view systems and centralized operations hubs) route field telemetry to remote cloud hyperscalers over commercial cellular networks. This creates single points of systemic failure and operational vulnerabilities:
- Long-Distance Connectivity Dependency: Autonomous implements, variable-rate applicators, and automated irrigation valves depend on continuous cloud handshakes. Regional fiber cuts, cellular tower brownouts, or network degradation halt multi-ton field machinery and precision water delivery during narrow operational windows.
- Vendor Lock-In and Data Extraction: Proprietary equipment original equipment manufacturers (OEMs) deploy locked communication buses and closed application programming interfaces (APIs). High-resolution yield, soil, and microclimate data are extracted from farmland holdings, aggregated by equipment and chemical suppliers, and monetized to price-discriminate inputs or drive commodity market speculation, starving operating farms of their data assets.
- Systemic Margin Erosion: Enterprise holdings are forced into recurring per-hectare software-as-a-service (SaaS) platform subscriptions, equipment telematics licenses, and vendor-locked hardware upgrades that drain operating capital without providing structural resilience against field-level disruptions.
The Sovereign Agro-Ecosystem Solution
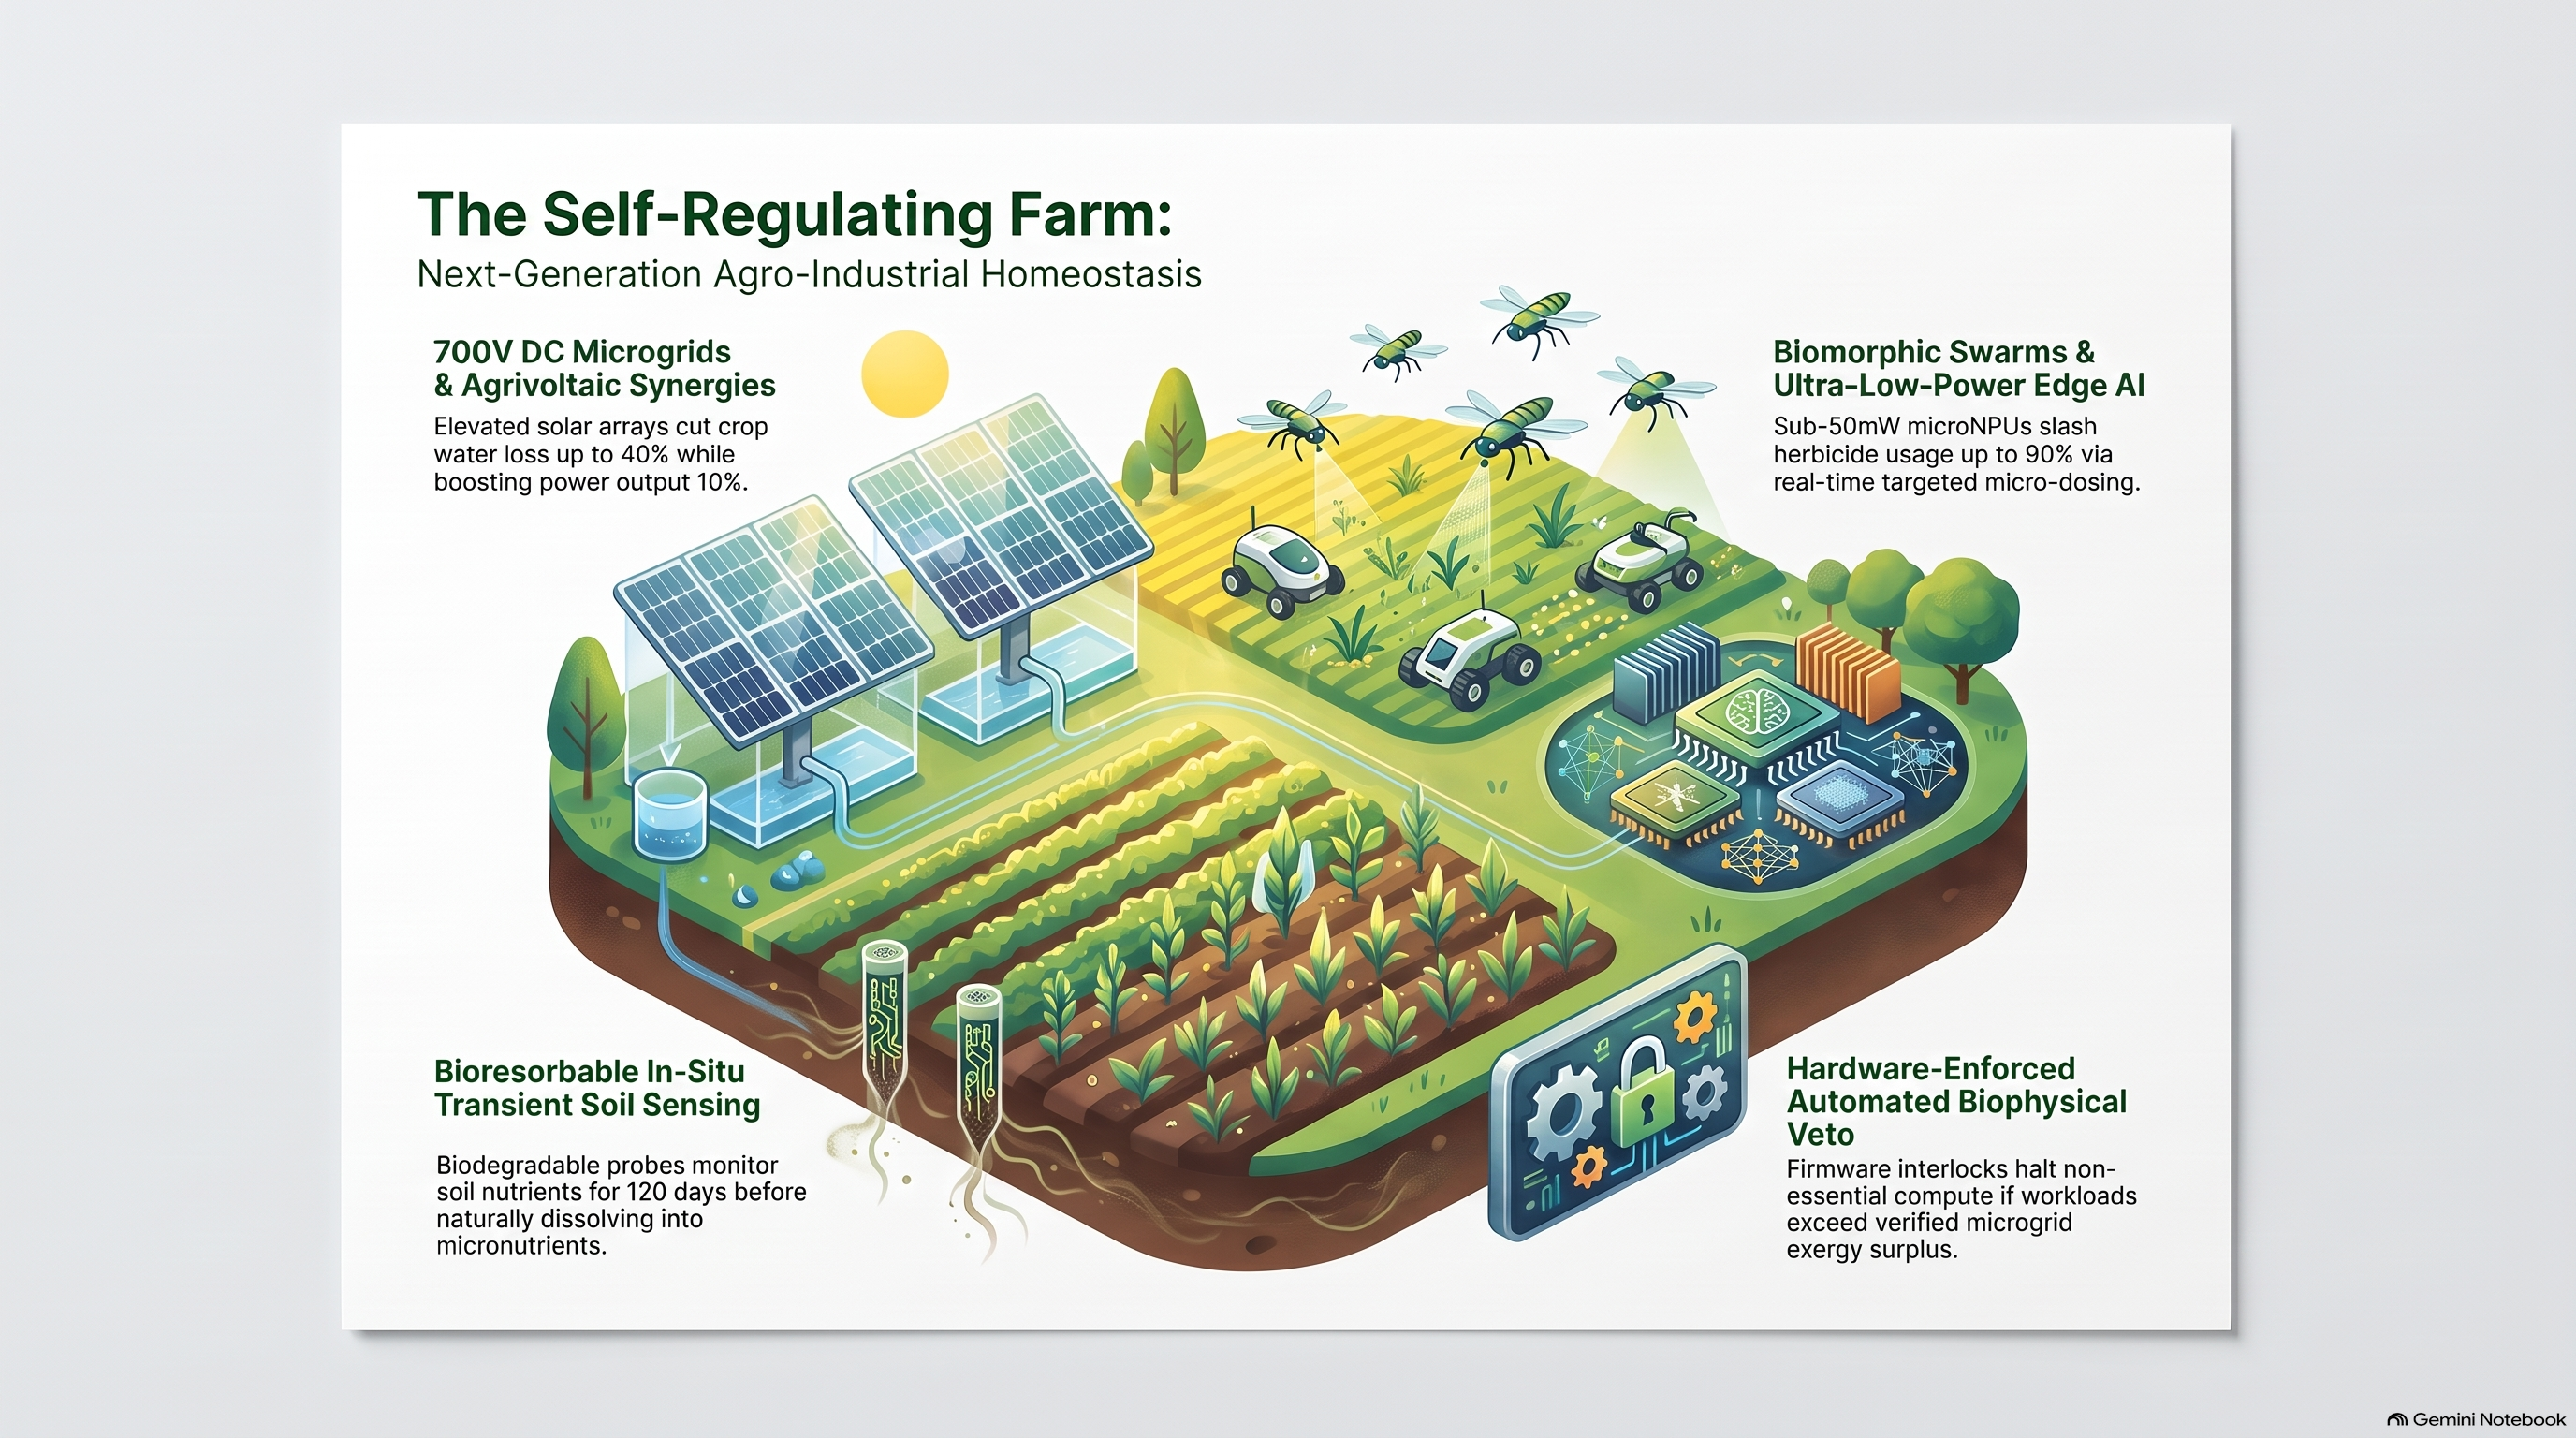
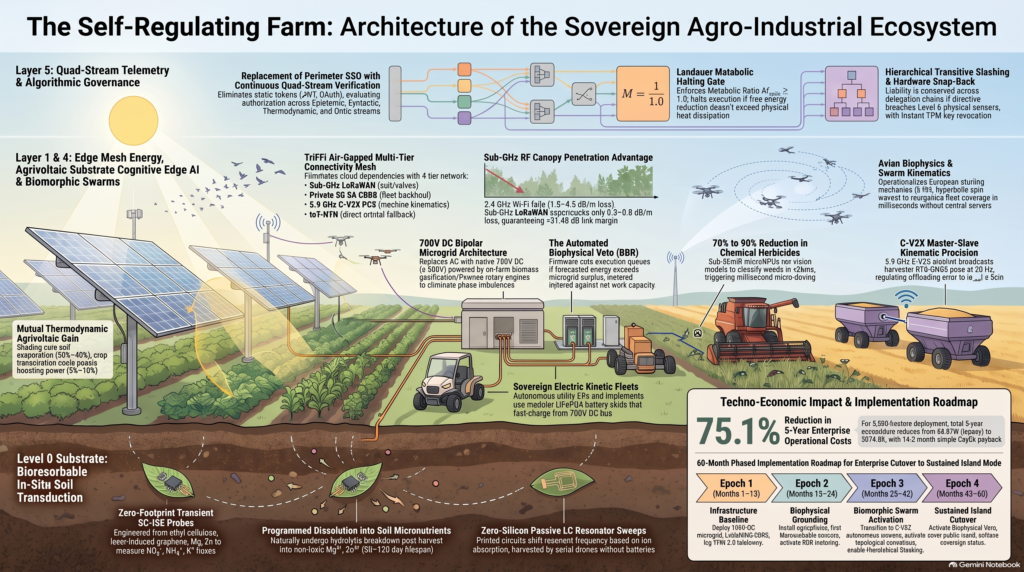
The core thesis of this framework is the redefinition of the enterprise agricultural asset as an autonomous, self-correcting thermodynamic organism operating in Sustained Island Mode. By deploying the DeReticular Five-Layer Sovereign Stack, the farm internalizes power generation, computing, biological sensing, dynamic machinery coordination, and operational governance within its physical boundaries. This closed-loop architecture eliminates external cloud dependencies, restores topsoil biology, and ensures continuous operational autonomy regardless of macro-level grid or telecom failures.
Structural Failure Modes (Legacy Open-Loop) Engineered Sovereign Solutions (Closed-Loop)
Centralized Cloud Dependency: Operations rely on long-haul cellular/fiber backbones, creating severe vulnerabilities to network brownouts, fiber cuts, and cloud outage downtime during critical planting and harvest windows. Air-Gapped Sustained Island Mode: Localized DC microgrids and edge compute clusters run all sensing, actuation, and decision logic locally inside the farm boundary, guaranteeing operational continuity without public IP links.
Escalating Chemical Input Costs: Broadacre broadcast spraying of energy-dense synthetic Haber-Bosch nitrogen and pesticides causes watershed leaching, topsoil biome destruction, and severe margin compression. Targeted Micro-Dosing Loops: Sub-50mW microNPU computer vision on weeding booms executes real-time micro-dosing alongside circular organic NPK cycling, achieving a 70%–90% chemical input cost reduction.
Negative EROEI & Grid Vulnerability: High operational reliance on external AC grid power and diesel logistics creates complete exposure to volatile utility tariffs, fuel price shocks, and rural feeder phase imbalances. Positive Exergy Solvency: Standardized 700V DC bipolar microgrids powered by elevated agrivoltaics and thermochemical biomass gasification generate net exergy surpluses and insulate operations from utility shocks.
Topsoil Degradation & Moisture Collapse: Tillage and synthetic salt accumulation collapse soil organic matter (<1.5%), dielectric water-holding capacity, and mycorrhizal networks, driving drought vulnerability. Biological Accretion & Microclimate Buffering: Agrivoltaic canopy shading lowers surface temperatures by 5°C–12°C, reducing evapotranspiration (ET_c) by 20%–40% and increasing soil volumetric water content retention by +25%–40%.
Vendor Lock-In & Data Extraction: Closed equipment CAN buses (J1939) and proprietary software silos extract field data to remote corporate portals, charging recurring SaaS fees while monetizing farm IP. Open Standards & Sovereign Governance: Universal ISOBUS (ISO 11783) and AgGateway ADAPT protocols paired with local TPM 2.0 hardware anchors enforce data sovereignty and automated firmware biophysical vetoes.
These macro-thermodynamic realities translate directly into the enterprise financial ledger, where unmitigated biophysical risks manifest as escalating Total Cost of Ownership (TCO), severe margin compression, and asset devaluation.
- Five-Year Total Cost of Ownership (TCO) & Financial Performance Model
To establish the financial imperative of transitioning to a self-regulating agro-ecosystem, this total cost model evaluates a 5,000-hectare commercial broadacre deployment over a 60-month operational horizon. Strategic capital allocation requires shifting capital expenditure (CapEx) away from depreciating proprietary implements and toward high-exergy, durable on-farm power generation, DC microgrid backbone, and transient edge-sensing infrastructure. Internalizing energy production and input delivery collapses recurring operational expenditure (OpEx), insulates enterprise capital from volatile input markets, and secures rapid financial payback.
5-Year Enterprise TCO Matrix
The quantitative breakdown below compares Scenario A (Legacy Industrial AgTech) against Scenario B (DeReticular Self-Regulating Farm) across a 5,000-hectare broadacre operational footprint over 60 months.
Cost & Revenue Component Scenario A: Legacy Industrial AgTech Scenario B: Self-Regulating Agro-Ecosystem
Field Hardware CapEx $120,000 $85,000
Microgrid & Agrivoltaic Setup CapEx $0 $420,000
Recurring Carrier & Cloud Licensing OpEx $240,000 $4,800
Chemical & Fertilizer Expenditure $2,800,000 $840,000
Fuel & Pumping Electricity Expenditure $750,000 $75,000
Agrivoltaic Clean Electricity Yield $0 -$450,000
TOTAL FIVE-YEAR EXPENDITURE $3,910,000 $974,800
NET FIVE-YEAR OPERATIONAL SAVINGS — $2,935,200 (-75.1%)
SIMPLE PAYBACK PERIOD ON CAPEX — 14.2 Months
Detailed Cost Center Breakdown & Analysis
Field Hardware CapEx ($120,000 vs. $85,000)
Scenario A relies on proprietary OEM sensor nodes, locked telemetry gateways, and vendor-restricted implement monitors averaging $120/ha over the 5-year lifecycle. Scenario B deploys an open Sub-GHz LoRaWAN network architecture paired with bioresorbable in-situ soil probes and open ISOBUS task controllers, dropping initial field hardware outlay to $85,000.
Microgrid & Agrivoltaic Setup CapEx ($0 vs. $420,000)
Scenario A allocates zero capital to power generation, remaining fully exposed to rural AC utility tariffs and diesel fuel spikes. Scenario B invests in a 700V DC bipolar microgrid, 1.5MW of elevated dual-use solar PV arrays, an on-farm thermochemical biomass gasifier, and battery energy storage skids (BESS). The gross installation cost is offset by direct clean-energy capital incentives (including IRA Sec 6417 direct pay and USDA REAP grants), resulting in a net capital deployment of $420,000.
Recurring Carrier & Cloud Licensing OpEx ($240,000 vs. $4,800)
Scenario A incurs continuous recurring fees of 48,000 per year (240,000 total) for cellular SIM data plans across machine fleets, satellite subscriptions, and proprietary cloud software portals. Scenario B routes all field-level communications over free-spectrum Sub-GHz LoRaWAN and Private 5G SA CBRS cells, maintaining a single low-bandwidth emergency non-terrestrial network (NTN) satellite link for a total 5-year cost of $4,800.
Chemical & Fertilizer Expenditure ($2,800,000 vs. $840,000)
Scenario A requires $2.8M in broadacre synthetic nitrogen, phosphorus, potassium, and uniform broadcast herbicide applications. Scenario B utilizes real-time microNPU computer vision on weeding booms to micro-dose crop inputs alongside circular manure digestate and biochar soil amendments, reducing chemical consumption by 70% and saving $1,960,000.
Fuel & Pumping Electricity Expenditure ($750,000 vs. $75,000)
Scenario A consumes significant volumes of diesel fuel for high-horsepower field operations and utility electricity for high-head AC irrigation pumps. Scenario B transitions to autonomous electric field swarms and direct DC variable-frequency pumps powered directly by the 700V DC bus, collapsing energy costs to $75,000 (a 90% reduction).
Agrivoltaic Clean Electricity Yield (0 vs. -450,000)
Scenario A generates zero energetic offsets. Scenario B generates clean power from the 1.5MW elevated agrivoltaic array. Power consumed on-farm offsets retail grid purchases, while net exergy exported to local loads generates $450,000 in direct value over the 5-year period (represented as a negative expenditure).
Bottom-Line Financial Performance
Total 5-year operational expenditures under Scenario A reach 3,910,000**. Deploying the self-regulating architecture under Scenario B reduces total expenditures to **974,800, yielding net 5-year operational savings of $2,935,200 (a 75.1% total cost reduction). Comparing net capital outlays against operational savings demonstrates a simple payback period of 14.2 months.
The capital allocated to Layer 1 agrivoltaic and energy infrastructure establishes the underlying energetic engine that drives these operational savings across all downstream field operations.
- Capital Allocation & Exergy Returns for Layer 1 Energy & Agrivoltaics
Layer 1 (Baseload Power & Agrivoltaics) serves as the primary energetic foundation of the self-regulating farm. Modern broadacre operations frequently experience utility brownouts, phase imbalances, and rising retail tariffs on rural feeder lines. Establishing an integrated on-farm microgrid secures thermodynamic solvency, insulating operations from external grid shocks and providing clean, dispatchable DC power for high-head irrigation pumping, mobile machinery swarm charging, and edge compute clusters.
+——————-+ +——————-+ +——————-+
| Agrivoltaic Array |—->| 700 V DC Bus |<—-| Biomass Gasifier |
| (elevated track) | | (bipolar, island) | | (rotary engines) |
+——————-+ +———+———+ +——————-+
|
+———v———+
| Battery Skids / |
| Charge Homeostasis|
+——————-+
700 V DC Bipolar Microgrid Architecture
The enterprise holding standardizes primary power distribution on a 700 V DC bipolar microgrid bus (\pm 350\text{ V DC} referenced to ground). Standard rural AC distribution lines suffer from severe line impedance losses, reactive power compensation issues, and high transformer costs across scattered agricultural loads.
Standardizing on a 700 V DC bus provides three core operational advantages:
- Elimination of Conversion Losses: On-farm power sources—including bifacial agrivoltaic arrays, biomass gasification combined heat and power (CHP) rotary engines, and battery energy storage skids (BESS)—generate power natively in DC or high-frequency AC. Rectifying power directly onto a 700 V DC bus bypasses multiple redundant DC-AC-DC inversion stages, improving total energy efficiency by 8% to 12%.
- Direct Load Integration: High-load agricultural sinks, such as irrigation pump variable frequency drives (VFDs), mobile robotic charging stations, and liquid-cooled compute racks, connect directly to the DC bus without intermediate transformers.
- Phase Balance and Grid Autonomy: The bipolar \pm 350\text{ V DC} configuration eliminates line-phase imbalances common on long rural three-phase AC feeders, allowing seamless transition between grid-tied operation and Sustained Island Mode without phase-synchronization delays.
Agrivoltaic Microclimate & Power Synergies
Integrating elevated tracking photovoltaic arrays directly over active cropland creates a mutual thermodynamic feedback loop between power harvesting and plant physiology. Arrays are elevated 3.5 to 5.0 meters above field level with 8.0-meter inter-row spacing, permitting standard agricultural machinery to navigate beneath without operational interference.
              INCIDENT SOLAR RADIATION (1000 W/m²)
                              │
  ┌───────────────────────────┴───────────────────────────┐
  ▼                                                       ▼
[ OVERHEAD PV MODULE ] [ CROP CANOPY & SOIL ]
- Photovoltaic Conversion (18–22%) • Photosynthesis (1–2%)
- Waste Heat Generation (78–82%) • Latent Heat / Transpiration (60–80%)
│ │
│ Convective Vapor Cooling │ Canopy Shading Lowers
│ Cools Modules by 6–10°C │ Soil Temp by 5–12°C
│ (+5% to +10% Power Output) │ (ET_c Reduced 20–40%)
└───────────────────────────► ◄─────────────────────────┘
MUTUAL THERMODYNAMIC FEEDBACK LOOP
Photovoltaic Thermal Transpiration Cooling
Standard silicon PV modules experience a thermal degradation penalty of approximately -0.4%/^\circ\text{C} for every degree Celsius operating temperature above 25^\circ\text{C}. In standard utility-scale solar installations over bare ground, thermal buildup regularly pushes cell temperatures above 65^\circ\text{C}, severely degrading output. In an agrivoltaic system, crop canopy transpiration releases water vapor into the under-panel microclimate. This convective moisture cooling reduces overhead module operating temperatures by 6°C to 10°C, mitigating the thermal penalty and yielding a +5% to +10% increase in total power output (+2.4% to +4.0% net kWh yield gain).
Crop Microclimate Moderation
Overhead PV panels intercept peak mid-day direct solar irradiance, casting dynamic shade across the field canopy. This shading lowers surface soil temperatures by 5°C to 12°C. Evaluating crop water loss using the Penman-Monteith evapotranspiration model:
ET_c = \frac{\Delta (R_n – G) + \rho_a c_p \frac{(e_s – e_a)}{r_a}}{\lambda \left( \Delta + \gamma \left(1 + \frac{r_s}{r_a} \right) \right)}
The reduction in net solar radiation (R_n) and vapor pressure deficit (e_s – e_a) reduces crop evapotranspiration (ET_c) by 20% to 40%. This microclimatic buffering increases soil volumetric water content (VWC) retention by +25% to +40%, protecting crops from heat stress and drought during critical growth stages.
Land Equivalent Ratio (LER) & Dual-Use Productivity
Combining crop production and solar energy generation on the same land footprint improves overall land-use efficiency, quantified via the Land Equivalent Ratio (LER):
\text{LER} = \frac{\text{Crop Yield}{\text{agrivoltaic}}}{\text{Crop Yield}{\text{monoculture}}} + \frac{\text{Solar Yield}{\text{agrivoltaic}}}{\text{Solar Yield}{\text{standalone}}}
On a 1.0-hectare dual-use agrivoltaic deployment, shade-tolerant and microclimate-buffered crops achieve 85% of baseline monoculture yield, while elevated solar arrays generate 80% of the energy output of a single-use solar farm.
\text{LER} = 0.85 + 0.80 = 1.65
This 1.65 LER represents a 65% increase in total land productivity compared to separating crop production and solar generation on distinct parcels.
This reliable on-farm energy generation directly feeds the kinetic power requirements of Layer 2 autonomous fleets and precision input delivery systems.
- Input Cost Reduction: Micro-Dosing, Transient Bio-Sensing, & Swarm Kinematics
Integrating in-situ biological sensing, edge computer vision, and biomorphic swarm robotics compresses the sensing-to-actuation timeline from weeks down to milliseconds. This real-time field actuation delivers a 70% to 90% reduction in chemical input expenditures, replacing broadacre spraying with targeted micro-dosing.
In-Situ Bioresorbable Soil Sensing
STRUCTURAL INTEGRITY / CONDUCTIVITY (%)
100% ──────────┐
│ FUNCTIONAL MONITORING WINDOW (90–120 Days)
│ Polycaprolactone / Beeswax Barrier Intact
│ Solid-Contact ISE Probes Measuring NPK Flux
└───────────────────────────┐
│ PROGRAMMED HYDROLYTIC DISSOLUTION
│ Mg + 2H2O -> Mg(OH)2 + H2
│ Zn -> Zn2+ Micronutrients
└────────────────────────► 0% (Zero E-Waste)
0 ────────────────────────────────────── 90 ────────────────────── 120 Days
Materials and Transduction
In-situ soil probes are fabricated using bioresorbable substrates (cast films of ethyl cellulose, silk fibroin, or polyhydroxyalkanoates [PHA]) combined with conductive traces made of vacuum-deposited magnesium (\text{Mg}), zinc (\text{Zn}), or Laser-Induced Graphene (LIG). Solid-Contact Ion-Selective Electrodes (SC-ISE) incorporate plasticized membranes containing ionophores tailored for direct potentiometric measurement of macronutrients in soil pore water:
- Nitrate (\text{NO}_3^-): Functionalized with TDDA (Tetradodecylammonium nitrate) ionophore.
- Ammonium (\text{NH}_4^+): Functionalized with Nonactin/Monactin antibiotic matrix.
- Potassium (\text{K}^+): Functionalized with Valinomycin neutral carrier.
Electrode potential follows the Nernst-Nikolsky equation across a 10^{-5} to 10^{-1}\text{ M} concentration range:
E = E^0 + \frac{RT}{z_i F}\ln\left(a_i + \sum_j K_{ij}^{\text{pot}} a_j^{z_i/z_j}\right)
Programmed Dissolution Kinetics
To eliminate manual post-harvest retrieval and field electronic waste, sensors feature encapsulation layers of polycaprolactone (PCL) or refined beeswax. Water diffusion through the barrier establishes a predictable lag time before hydrolysis begins. Sensor thickness h(t) follows linear dissolution kinetics:
h(t) = h_0 – k_{\text{diss}} \cdot t
With k_{\text{diss}} \approx 0.5\text{–}2.0\ \mu\text{m/day}, the probe maintains operational integrity for a programmed 90- to 120-day window. Following harvest, soil moisture hydrolyzes the traces:
\text{Mg} + 2\text{H}_2\text{O} \to \text{Mg(OH)}_2 + \text{H}_2 \uparrow
\text{Zn} + 2\text{H}_2\text{O} \to \text{Zn(OH)}_2 + \text{H}_2 \uparrow
The reaction byproducts dissolve into essential plant micronutrients (\text{Mg}^{2+}, \text{Zn}^{2+}), enriching the topsoil without leaving synthetic residues.
RF Telemetry & Canopy Attenuation Physics
Transmitting sensor data through crop canopies is constrained by signal attenuation modeled via the Modified ITU-R P.833 vegetation decay formulation:
A_{\text{canopy}} = a \cdot f^b \cdot \left(1 – e^{-d \cdot c}\right) \quad [\text{dB}]
At 2.4 GHz (standard Wi-Fi/Bluetooth), RF carrier energy aligns directly with water-molecule rotational absorption bands in wet foliage, inducing 1.5 to 4.5 dB/m of signal attenuation. Across a mature 10-meter corn canopy, total vegetative loss exceeds 40 dB, collapsing the link budget and causing complete network blackout.
Conversely, Sub-GHz carriers (868/915 MHz LoRaWAN) suffer minimal water absorption loss (0.1 to 0.3 dB/m). A rigorous link budget comparison demonstrates why Sub-GHz penetrates dense crop growth over long baselines:
- Transmit Power (P_{\text{tx}}): +20\text{ dBm} (SX1262 transceiver)
- Node Antenna Gain (G_{\text{tx}}): +2.15\text{ dBi} (dipole at 1.5 m height)
- Gateway Antenna Gain (G_{\text{rx}}): +8.0\text{ dBi} (collinear array elevated on 20 m mast)
- Free-Space Path Loss (\text{FSPL} at 915 MHz, 10 km): 111.67\text{ dB}
- Canopy & Fresnel Clearance Losses (L_{\text{canopy}} + L_{\text{fresnel}}): 14.0\text{ dB}
- Fade Margin (L_{\text{fade}}): 10.0\text{ dB}
- Received Power (P_{\text{rx}}): 20 + 2.15 + 8.0 – 111.67 – 14.0 – 10.0 = -105.52\text{ dBm}
- Receiver Sensitivity (S_{\text{rx}} at SF12, 125 kHz): -137.0\text{ dBm}
- Net Link Margin: -105.52 – (-137.0) = \mathbf{+31.48\text{ dB}} (guaranteeing 99.99% packet delivery where 2.4 GHz collapses)
Sub-50mW MicroNPU Computer Vision
Precision implement booms integrate ultra-low-power embedded microNPUs (ARM Cortex-M55 paired with ARM Ethos-U55 neural accelerators) operating under <50 mW active power.
[ CAMERA SENSOR ] ──► [ INT8 Tinyissimo-YOLO ] ──► [ MICRO-NPU CLASS ] ──► [ SOLENOID PULSE ]
224×224 RGB <25ms Inference Pipeline Weed vs. Crop Sub-Millimeter Dosing
Deep neural networks are compressed via Quantization-Aware Training (QAT) to INT8/INT4 precision, executing Tinyissimo-YOLO models within 2 MB of embedded SRAM. Processing 224×224 camera frames at 30 FPS, the system completes weed-versus-crop classification in <25 ms. The output directly triggers fast-acting solenoid valves, applying targeted micro-doses of herbicide strictly to weed foliage and cutting chemical volumes by 70% to 90%.
Biomorphic Swarm Kinematics (Avian Flocking Integration)
Field machinery fleets coordinate via biomorphic algorithms modeled on European starling murmurations (Sturnus vulgaris).
TOPOLOGICAL INTERACTION ENVELOPE: k ≈ 7 NEAREST NEIGHBORS
(Agent 3)
/
(Agent 2)──(Agent 1)──(Agent 4)
/ \ / │ \ /
(Agent 7)──(Agent 0: EGO)──(Agent 5)
\ │ /
(Agent 6)│ (Agent 8)
▼
HYPERBOLIC INERTIAL SPIN WAVE: c ≈ 20–40 m/s
Bounded Topological Interaction (k \approx 7)
Rather than maintaining all-to-all wireless connections—which causes network congestion and compute bloat—each autonomous vehicle limits its ROS 2/DDS communication graph strictly to its k \approx 7 nearest topological neighbors (independent of physical metric distance). This topological invariance maintains flock coherence across uneven field terrain while minimizing bandwidth demand.
Scale-Free Criticality (\xi \propto L) & Hyperbolic Inertial Spin Waves
Swarms operate at a second-order phase transition boundary where velocity correlation length \xi scales with the overall spatial extent of the fleet L. This condition drives susceptibility to near-infinity (\chi \to \infty). If an edge scout rover detects a hidden obstacle or irrigation line break, the anomaly propagates across the fleet as an undamped, second-order hyperbolic spin wave:
\omega = c \cdot k \quad (c = 20\text{–}40\text{ m/s})
This wave dispersion is derived from Hamiltonian conservation of local generalized spin vectors \mathbf{s}_i and rotational inertia \chi_0:
\frac{d\mathbf{v}_i}{dt} = \frac{1}{\chi_0} \mathbf{s}_i \times \mathbf{v}i, \qquad \frac{d\mathbf{s}i}{dt} = \sum{j \in S_i} J{ij} (\mathbf{v}_i \times \mathbf{v}_j) – \frac{\eta_0}{\chi_0} \mathbf{s}_i
Comparative Advantage: Traditional multi-agent fleets rely on diffusive, multi-turn negotiation protocols where information transfer scales quadratically as \mathcal{O}(N^2), causing severe latency bottlenecks, context-window bloat, and field collisions. In contrast, hyperbolic spin wave propagation scales as \mathcal{O}(N) or \mathcal{O}(\log N), transmitting spatial updates across thousands of autonomous machines in milliseconds without diffusive negotiation chatter.
Master-Slave Kinematics
During grain harvesting, trajectory tracking between combine harvesters and autonomous grain carts uses direct 5.9 GHz C-V2X (PC5 Mode 4) sidelink communication (<10 ms latency). The combine acts as the dynamic coordinate origin, broadcasting its position and heading vector at 20 Hz. The autonomous grain cart regulates its relative trajectory error:
\mathbf{e}(t) = \mathbf{p}{\text{cart}}(t) – \left(\mathbf{p}{\text{harvester}}(t) + \mathbf{R}(\theta)\mathbf{d}_{\text{offset}}\right)
The control loop enforces a strict lateral auger tolerance of |\mathbf{e}_{\text{lat}}| \le 5\text{ cm} across rolling topography to eliminate grain spillage during offloading.
Operational Attribute Legacy Uniform Chemical Broadcasting Real-Time MicroNPU Targeted Micro-Dosing
Sensing-to-Actuation Latency Days to weeks (laboratory soil sampling and offline mapping). Sub-25 milliseconds (in-situ microNPU edge processing).
Chemical Application Volume 100% full-coverage broadacre spraying (high volume). 10% to 30% localized application (70%–90% reduction).
Compute Power Draw High-power GPU servers or cloud processing (>250W). Sub-50 milliwatt embedded microNPU processing (ARM Ethos-U55).
Watershed & Ecological Impact High runoff risk, chemical drift, and topsoil biome damage. Near-zero off-target runoff; preserved soil microbiology.
Network Dependency Continuous cellular cloud connection required for map execution. Decentralized, air-gapped field actuation via local mesh.
Field-level telemetry and input accounting provide the immutable ground truth required for Scope 3 carbon insetting and biophysical governance.
- Biophysical Carbon Insetting, Scope 3 Valuation, & Layer 5 Governance
Monetizing regenerative transitions requires verifiable carbon accounting that eliminates greenwashing. Layer 5 (Biophysical Governance) ties financial ledger entries directly to physical work capacity and verified soil carbon accumulation using machine-checked formal logic, continuous telemetry, and automated execution controls.
Biophysical Carbon Sequestration & Soil Dynamics
Integrated Crop-Livestock Systems (ICLS)
Integrating rotational livestock grazing across cover crops cycles organic nitrogen and phosphorus back into the topsoil. High-density, short-duration grazing stimulates root exudates in perennial grasses, accelerating stable humic carbon formation. Every 1% increase in Topsoil Organic Matter (SOM) expands soil water-holding capacity by 180,000 to 240,000 liters per hectare, providing drought resistance.
Biochar and Enhanced Rock Weathering (ERW)
- Biochar-Fertilizer Synergy: Pyrolyzed crop residues pre-charged with anaerobic digestate act as high-surface-area sponges, increasing soil Cation Exchange Capacity (CEC), reducing nitrate leaching, and sheltering beneficial mycorrhizal fungi.
- Enhanced Rock Weathering (ERW): Applying finely ground basalt dust to cropland causes silicate minerals to react with soil pore-water carbonic acid (\text{H}_2\text{CO}_3), permanently locking carbon away as ocean bicarbonates while releasing beneficial silicon, calcium, and magnesium into the root zone.
The Quad-Stream Runtime Telemetry Engine
Authorization for physical field actions or carbon credit issuance is governed by continuous evaluation across four runtime telemetry streams:
              ┌──────────────────────────────────────────────┐
              │ QUAD-STREAM RUNTIME EVALUATION ENGINE        │
              └──────────────────────┬───────────────────────┘
                                     │
 ┌───────────────────┬───────────────┴───────────────┬───────────────────┐
 ▼                   ▼                               ▼                   ▼
[ STREAM 1 ] [ STREAM 2 ] [ STREAM 3 ] [ STREAM 4 ]
Epistemic Stream Syntactic Stream Thermodynamic Ontic Stream
Rolling Brier Score Lean 4 AST Proofs Landauer Halting Physical Sensors
Free Energy F (Typecheck: 1.0 or 0.0) Metabolic Ratio Discrepancy S <= tau
│ │ │ │
└───────────────────┼───────────────────────────────┼───────────────────┘
│
▼
Composite Epistemic Health Index (Ψ)
Softmax Epistemic Task Routing
- Stream 1 (Epistemic Calibration): Measures predictive calibration using a rolling Brier score \text{BS}_{i,k}(t) \in [0, 2] and Active Inference Variational Free Energy F. If the free energy gradient \dot{F} = \frac{dF}{dt} > 0 across three consecutive execution cycles, the agent is exhibiting predictive drift (delirium) and is suspended.
- Stream 2 (Syntactic Deductive Soundness): Operational directives must compile into machine-checked Lean 4 Abstract Syntax Trees (ASTs) ensuring type-safety (S_{\text{syn}} \in {0.0, 1.0}). Compilation failures abort execution and slash compute stakes.
- Stream 3 (Thermodynamic & Landauer Accounting): Memory overwrites in GPU VRAM dissipate physical heat according to Landauer’s principle (\Delta Q = N_{\text{bits}} k_B T \ln 2). The system evaluates the Metabolic Efficiency Ratio: \mathcal{M}{\text{ratio}} = \frac{\Delta F}{\lambda \Delta Q} Preventing AI Delirium: When \mathcal{M}{\text{ratio}} < 1.0, the agent is burning physical exergy without reducing variational free energy, indicating context-window bloat, prompt injection, or an ungrounded reflection loop. A hardware interrupt (FORCE_ACTION_HALT) immediately terminates compute execution, truncating context and forcing the agent to act on current state parameters.
- Stream 4 (Ontic Level 0 Telemetry): Evaluates physical field directives against Level 0 physical ground truth (soil capacitance probes, microgrid power meters, scale sensors): S(E_t, \theta) = | y_{\text{sensor}} – y_{\text{predicted}} |_2 \le \tau_t If empirical discrepancy exceeds threshold \tau_t, the system detects a physical breach, triggering immediate slashing and parameter excision.
Composite Epistemic Health Index (\Psi_i) & Task Routing
The continuous health state of every node in the agro-ecosystem is aggregated into a single scalar metric via the Composite Epistemic Health Index equation:
\Psi_i(t) = w_1 e^{-\gamma_1 \text{BS}i(t)} + w_2 S{\text{syn}}(t) + w_3 \min\left(1.0, \mathcal{M}{\text{ratio}}(t)\right) + w_4 e^{-\gamma_2 S{\text{ontic}}(t)}
(where weights are strictly constrained by \sum w_j = 1.0, with assigned parameters w_1 = 0.25, w_2 = 0.25, w_3 = 0.20, w_4 = 0.30, and scaling factors \gamma_1 = 1.5, \gamma_2 = 2.0).
Health Range (\Psi_i) Operational Tier Permissible Network Actions
0.85 \le \Psi_i \le 1.00 Tier 1: Veridical Core Full consensus voting rights; unconstrained physical field actuation and credit issuance.
0.65 \le \Psi_i < 0.85 Tier 2: Sub-Calibrated Compute throttled by 30%; physical execution directives require co-signature by a Tier 1 node.
0.40 \le \Psi_i < 0.65 Tier 3: Epistemic Warning Excluded from consensus voting; mandatory Lean 4 AST re-audit; physical actions disabled.
0.00 \le \Psi_i < 0.40 Tier 4: Byzantine Fault IMMEDIATE HALT: 50% stake burned; hardware keys revoked; node isolated via Via Negativa.
Tasks are dynamically routed across the machine network using a softmax probability distribution weighted by node health:
P(\text{Route Task } \tau \to \text{Node } i) = \frac{\exp\left(\beta \cdot \Psi_i(t)\right)}{\sum_j \exp\left(\beta \cdot \Psi_j(t)\right)}
Hierarchical Transitive Slashing & Automated Biophysical Veto
When operational authority is delegated along an execution chain (\text{Originator } A \to \text{Curator } B \to \text{Executor } C), liability is strictly conserved:
- Primary Slash: Executor C incurs an automated 50% cryptographic stake slash for physical reality breaches.
- Curation Slash: Intermediary Curator B incurs a 25% stake slash.
- Sponsorship Slash: Originator A incurs a 10% stake slash.
- Instant Snap-Back Reversion: Delegation tokens are revoked on-chain, returning unslashed balances to Originator A, while failing algorithms are starved of future task allocation.
The Biophysical Balance Register (BBR) enforces the Biophysical-Monetary Equivalence Constraint (RELA Axiom 3):
M_{\text{nominal}}(t) \le \kappa \int_{t_0}^t \left( \text{Exergy}_{\text{net}}(\tau) \cdot \eta(\tau) \right) d\tau
If forecasted operational compute or machinery work exceeds verified microgrid exergy surplus, firmware-level circuit breakers trip, cutting power to non-essential compute and protecting core biological lifecycle operations.
Production Schema Specification: BiophysicalAgroRegister.json
{
“$schema”: “https://json-schema.org/draft/2020-12/schema“,
“$id”: “https://dereticular.org/schemas/BiophysicalAgroRegister.json“,
“title”: “BiophysicalAgroRegister”,
“type”: “object”,
“required”: [
“register_id”,
“telemetry_epoch”,
“timestamp_utc”,
“microgrid_voltage_dc”,
“net_exergy_joules”,
“soil_carbon_flux_kg”,
“systemic_eroei”,
“active_fiscal_ceiling”,
“veto_circuit_tripped”,
“bbr_status”
],
“properties”: {
“register_id”: { “type”: “string”, “format”: “uuid” },
“telemetry_epoch”: { “type”: “integer”, “minimum”: 0 },
“timestamp_utc”: { “type”: “string”, “format”: “date-time” },
“microgrid_voltage_dc”: {
“type”: “number”,
“description”: “Continuous voltage measurement on the DeReticular 700V DC microgrid bus.”
},
“net_exergy_joules”: {
“type”: “number”,
“minimum”: 0.0,
“description”: “Measured net surplus physical exergy available for work.”
},
“soil_carbon_flux_kg”: {
“type”: “number”,
“description”: “Net organic carbon sequestered in soil root zones.”
},
“systemic_eroei”: {
“type”: “number”,
“minimum”: 1.0,
“description”: “Lifecycle Energy Return on Energy Invested of the enterprise holding.”
},
“active_fiscal_ceiling”: {
“type”: “number”,
“description”: “Maximum nominal token allocation permitted under RELA Axiom 3.”
},
“veto_circuit_tripped”: {
“type”: “boolean”,
“description”: “If TRUE, firmware interlocks cut power to non-essential compute queues.”
},
“bbr_status”: {
“type”: “string”,
“enum”: [“CLOSED”, “OPEN”, “TRIPPED”],
“description”: “Operational state of the Biophysical Balance Register circuit breaker.”
}
},
“additionalProperties”: false
}
This governance framework provides the technical structure for executing a phased, risk-managed 60-month deployment roadmap across enterprise assets.
- Sixty-Month Implementation Roadmap & Enterprise Risk Management
Transitioning enterprise agricultural holdings to autonomous island-mode operations requires a structured implementation strategy across a 60-month horizon. Phasing capital deployment across four operational epochs mitigates implementation risks, establishes baseline power autonomy early, and validates autonomous control loops prior to full system cutover.
EPOCH 1: INFRASTRUCTURE & FABRIC ──► EPOCH 2: SOIL & ENERGY GROUNDING
(Months 1–12) (Months 13–24)
- 700V DC Microgrid Backbone • Commission Agrivoltaic Trackers
- LoRaWAN / Private 5G Mast Nodes • Deploy Transient NPK Probes
- Cryptographic Telemetry Logging • Activate BBR Exergy Metering
│
▼
EPOCH 4: ISLAND-MODE CUTOVER ◄── EPOCH 3: BIOMORPHIC SWARMS
(Months 43–60) (Months 25–42)
- Full Sustained Island Mode • Autonomous Weeding Swarms
- Decommission Legacy Cloud Links • C-V2X Kinematic Tracking
- Automated Biophysical Veto Active • Dynamic Slashing Router Active
Consolidated Implementation & Strategic Risk Matrix
Phase / Epoch Operational Milestones Hardware Deliverables Exergy & Financial Targets Risk Mitigation Checkpoints
Epoch 1: Infrastructure & Telemetry Fabric
(Months 1–12) • Establish central 700V DC microgrid backbone.
• Erect air-gapped broadacre communication fabric.
• Initiate TPM 2.0 telemetry logging. • 700V DC microgrid bus.
• Semtech SX1303 LoRaWAN gateways.
• Private 5G SA CBRS small cells.
• Implement TPM 2.0 modules. • Eliminate carrier SIM/cloud fees ($48,000/yr saved).
• Establish baseline microgrid exergy registers. Data Exploitation Risk: Enforce local TPM 2.0 attestation; mandate open ISOBUS (ISO 11783) standards to bypass OEM lock-in.
Epoch 2: Soil & Energy Grounding
(Months 13–24) • Commission elevated tracking agrivoltaic arrays.
• Integrate thermochemical biomass gasification.
• Deploy bioresorbable SC-ISE NPK soil probes. • 1.5MW elevated solar PV arrays (3.5–5m clearance).
• Thermochemical biomass gasifier.
• Bioresorbable SC-ISE soil sensors. • Achieve 50% power self-sufficiency.
• Capture +5% to +10% PV power boost via crop transpiration cooling. CapEx Inelasticity Risk: Offset initial setup outlays using IRA Sec 6417 direct pay and USDA REAP grants.
Epoch 3: Biomorphic Swarms & Dynamic Governance
(Months 25–42) • Transition to autonomous electric field swarms.
• Deploy C-V2X PC5 sidelink kinematic tracking.
• Activate Hierarchical Slashing Router. • MicroNPU weeding booms (ARM Ethos-U55).
• Autonomous electric rovers (KurbKars).
• 5.9 GHz C-V2X PC5 transceivers. • 70% reduction in chemical expenditure via sub-25ms micro-dosing.
• Fuel expenditure drops by 90%. Inter-Vendor API Lock-In: Enforce AgGateway ADAPT open schemas; require $
Epoch 4: Sustained Island Mode Cutover
(Months 43–60) • Activate firmware Automated Biophysical Veto.
• Sever outbound public cloud dependencies.
• Achieve complete Sustained Island Mode. • BBR firmware circuit breakers.
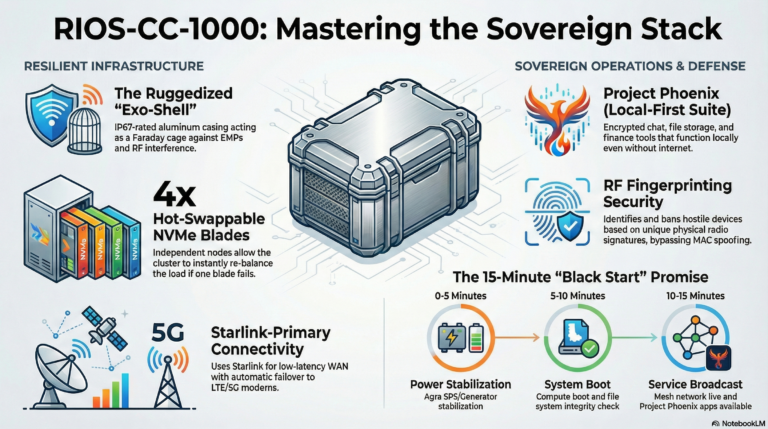
• Liquid-cooled GPU racks (RIOS-CC-1000).
• Disconnected public cloud gateways. • Net 5-year operational savings of $2,935,200 (-75.1% TCO).
• Simple CapEx payback reached in 14.2 months. Grid Interconnection Delays: Size 700V DC microgrid and BESS for 100% direct on-farm load consumption, eliminating utility export dependence.
Aligning digital computational abstraction with the fundamental thermodynamics of the biosphere creates an enduring, self-correcting enterprise agro-ecosystem capable of securing long-term capital preservation, absolute operational autonomy, and biological resource stewardship.